Total Number of Reporting Program Awardees: 27
Reporting Period: 2024
Total Patients Served: 661,041
Reporting Source: Uniform Data System (UDS) Report
Community Health Center Quality Recognition (CHQR) Badges
The CHQR badges recognize Health Center Program awardees and LALs that have made notable quality improvement achievements in the areas of access, quality, health equity, and health information technology for the most recent UDS reporting period. Learn more.
40.74%
7.41%
7.41%
7.41%
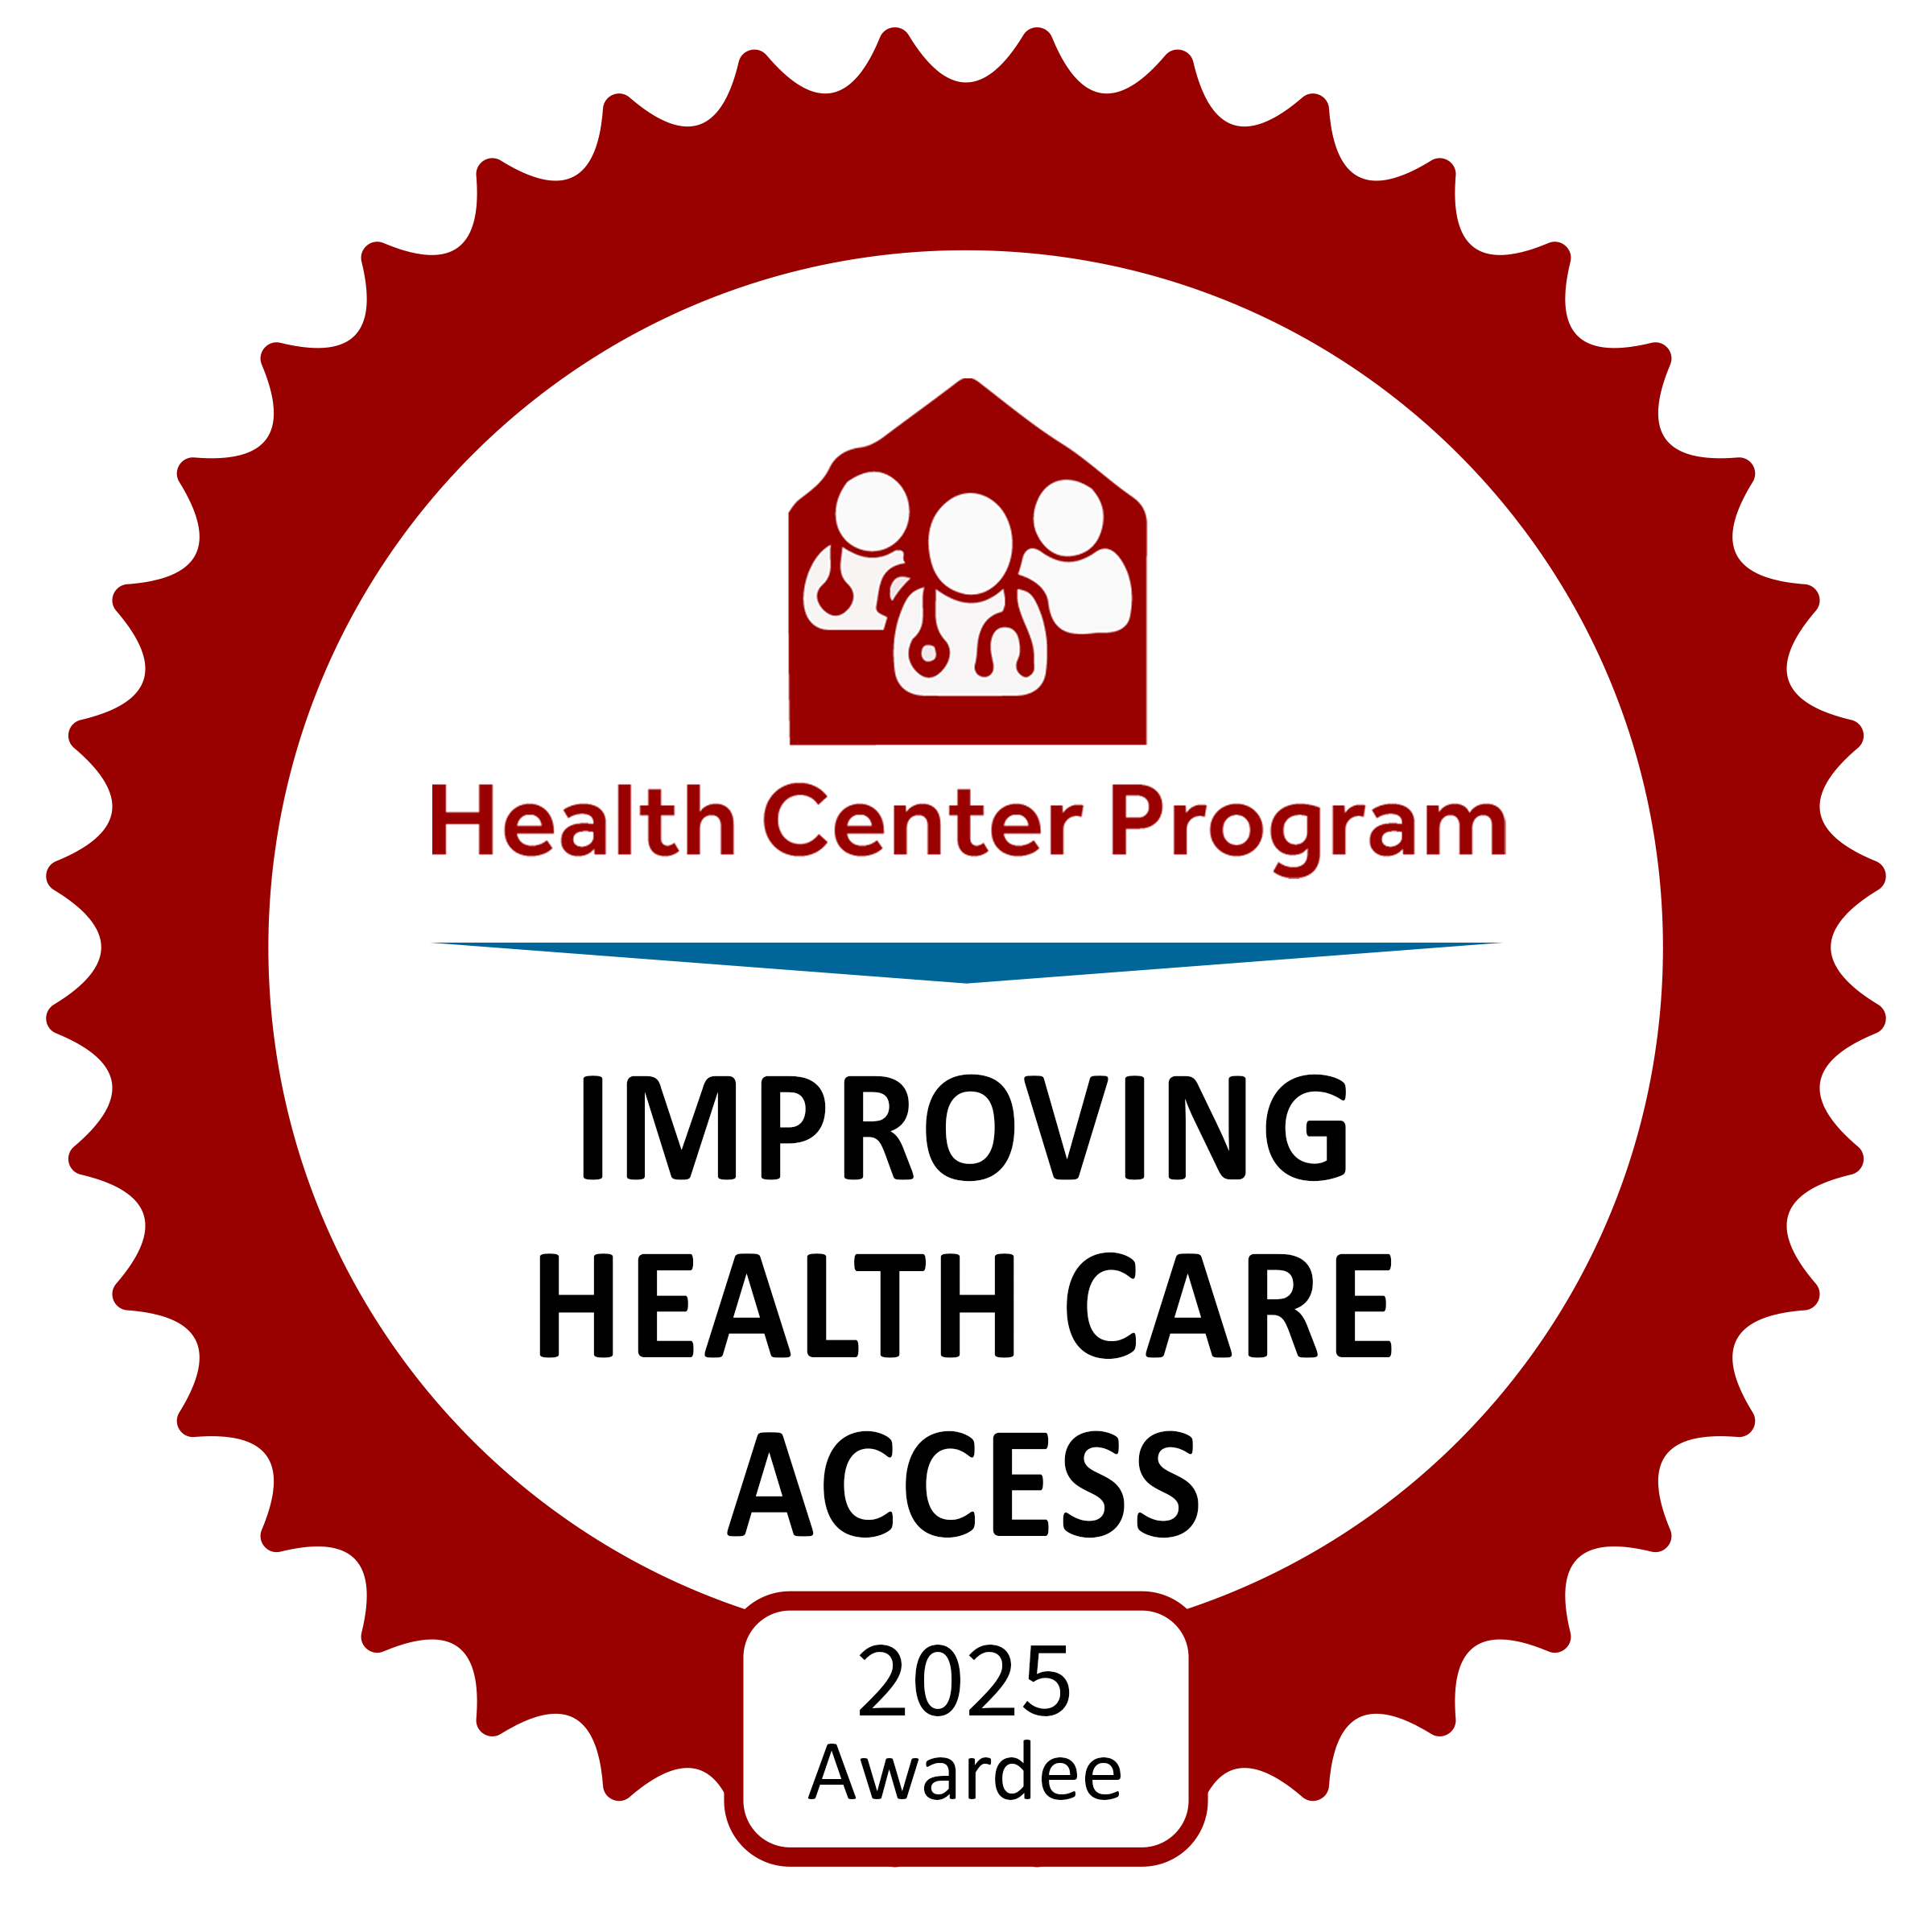
29.63%
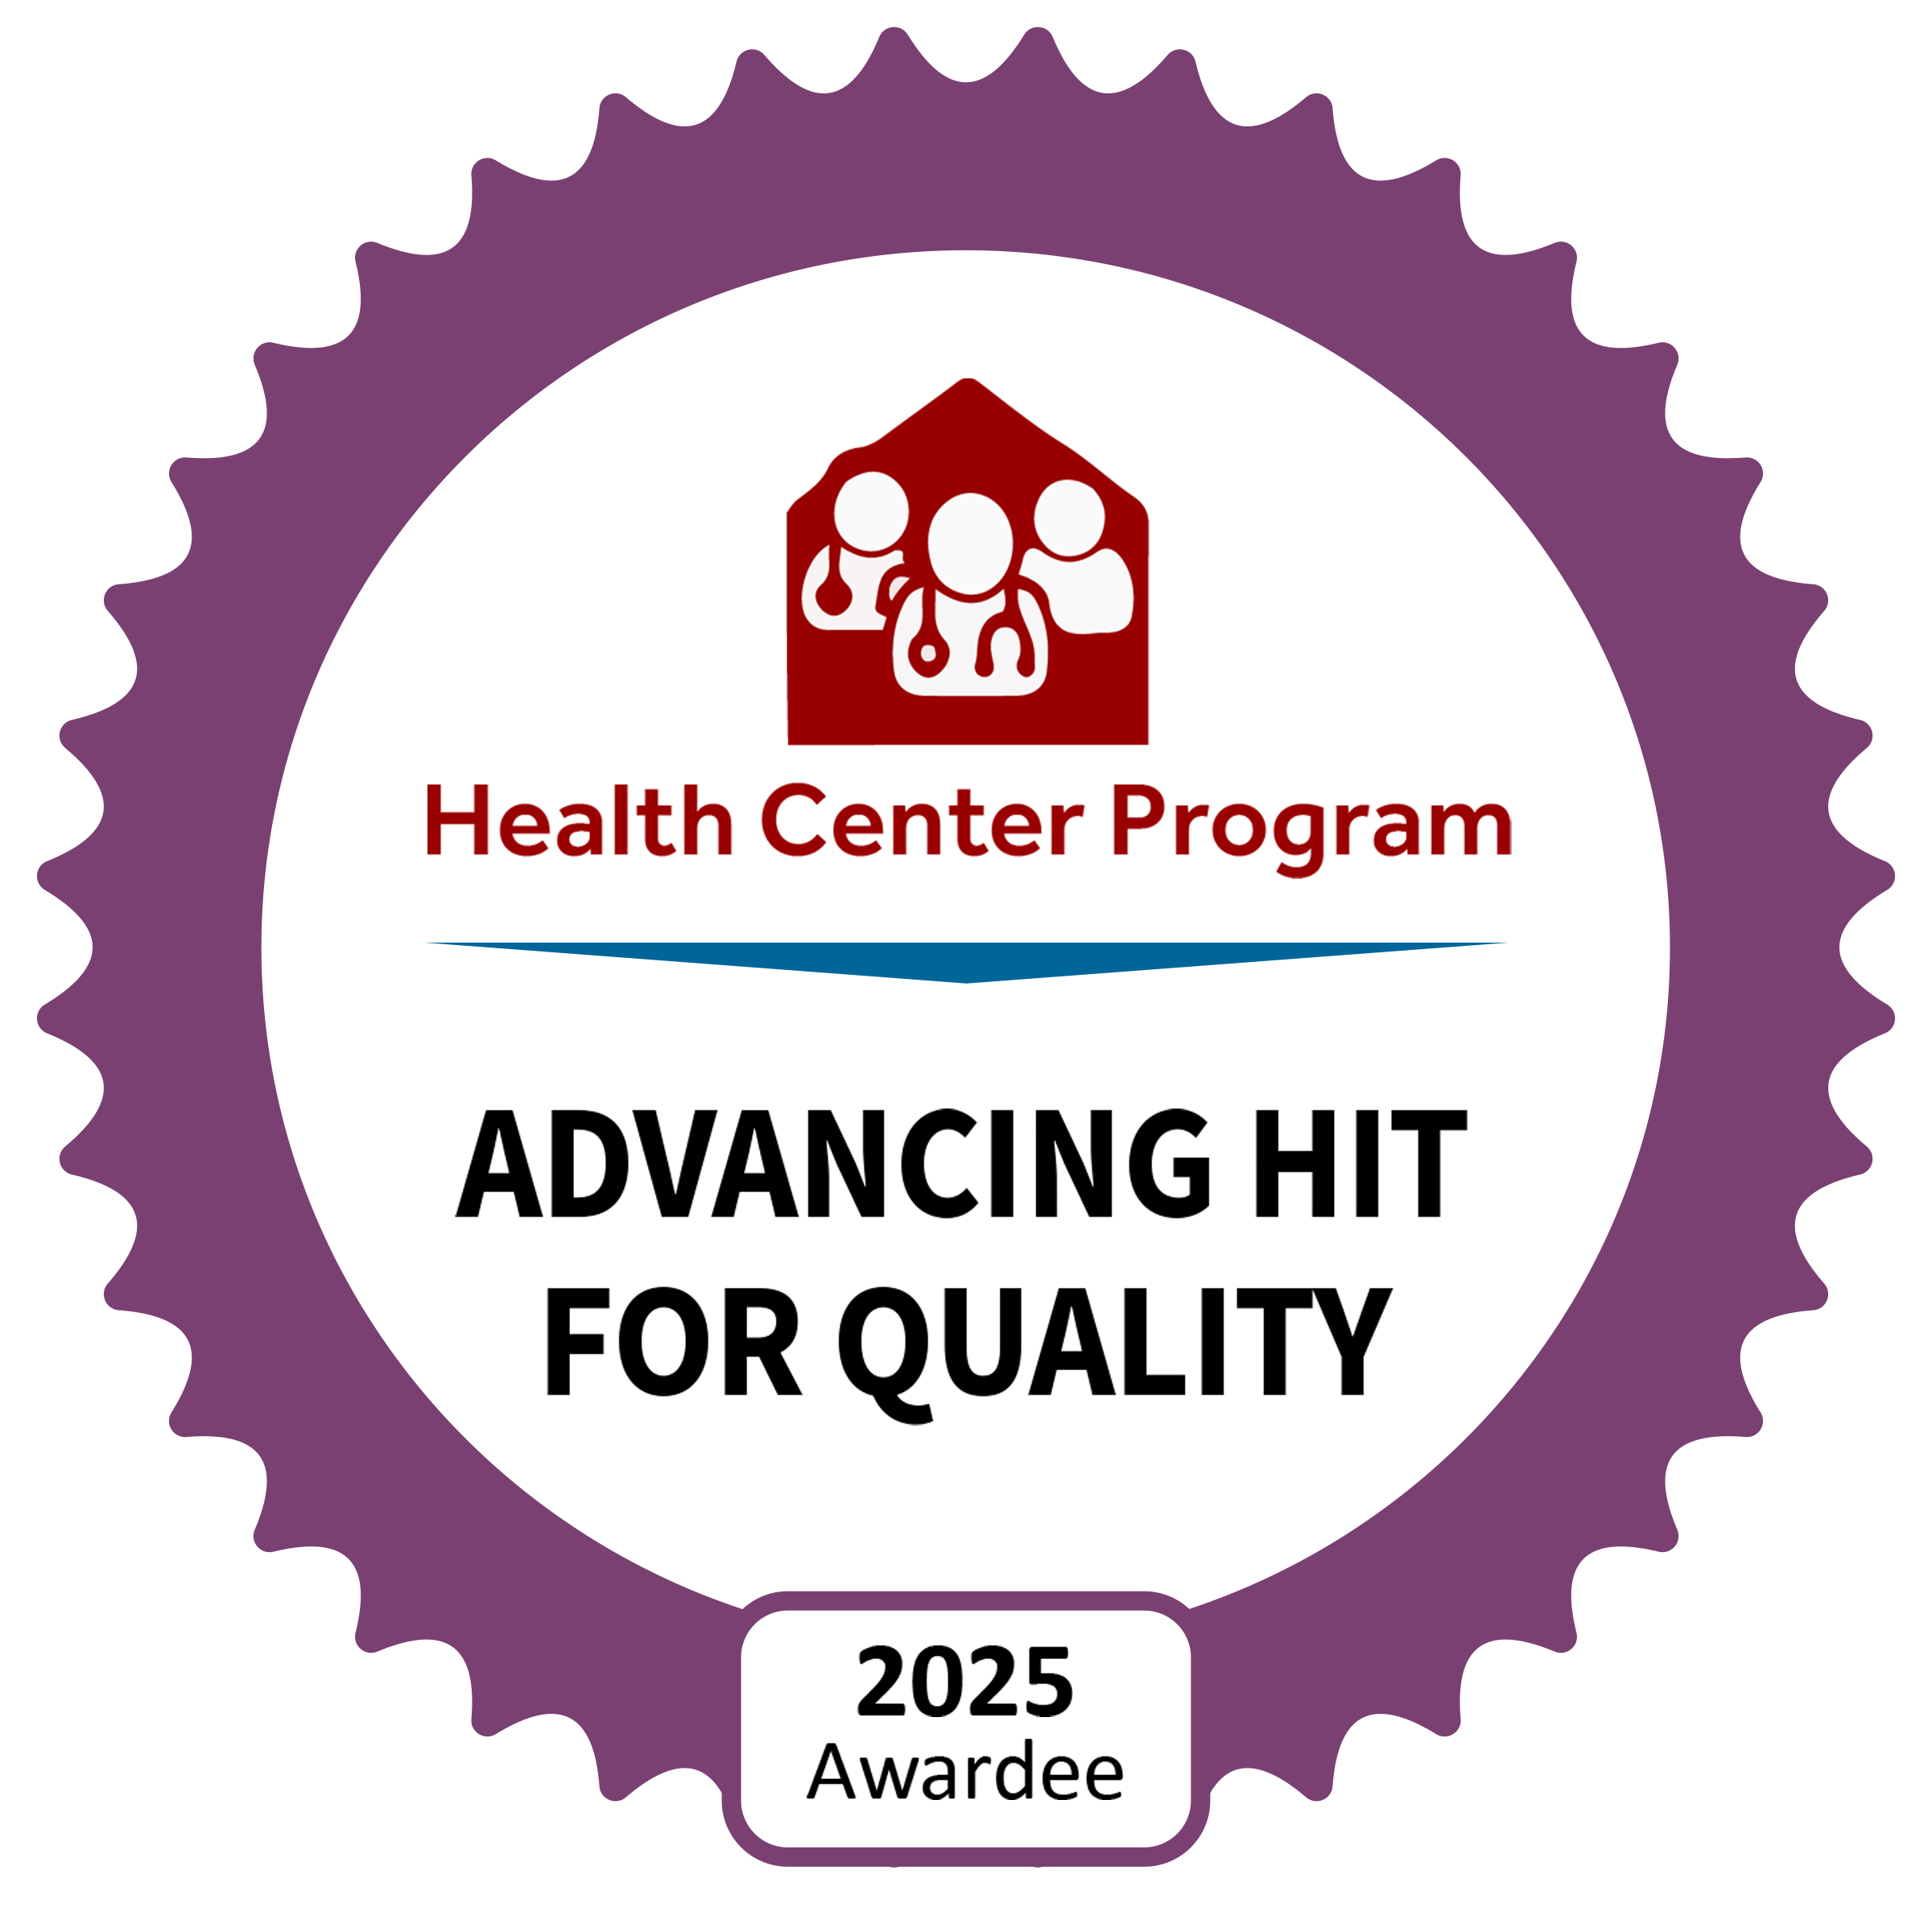
88.89%
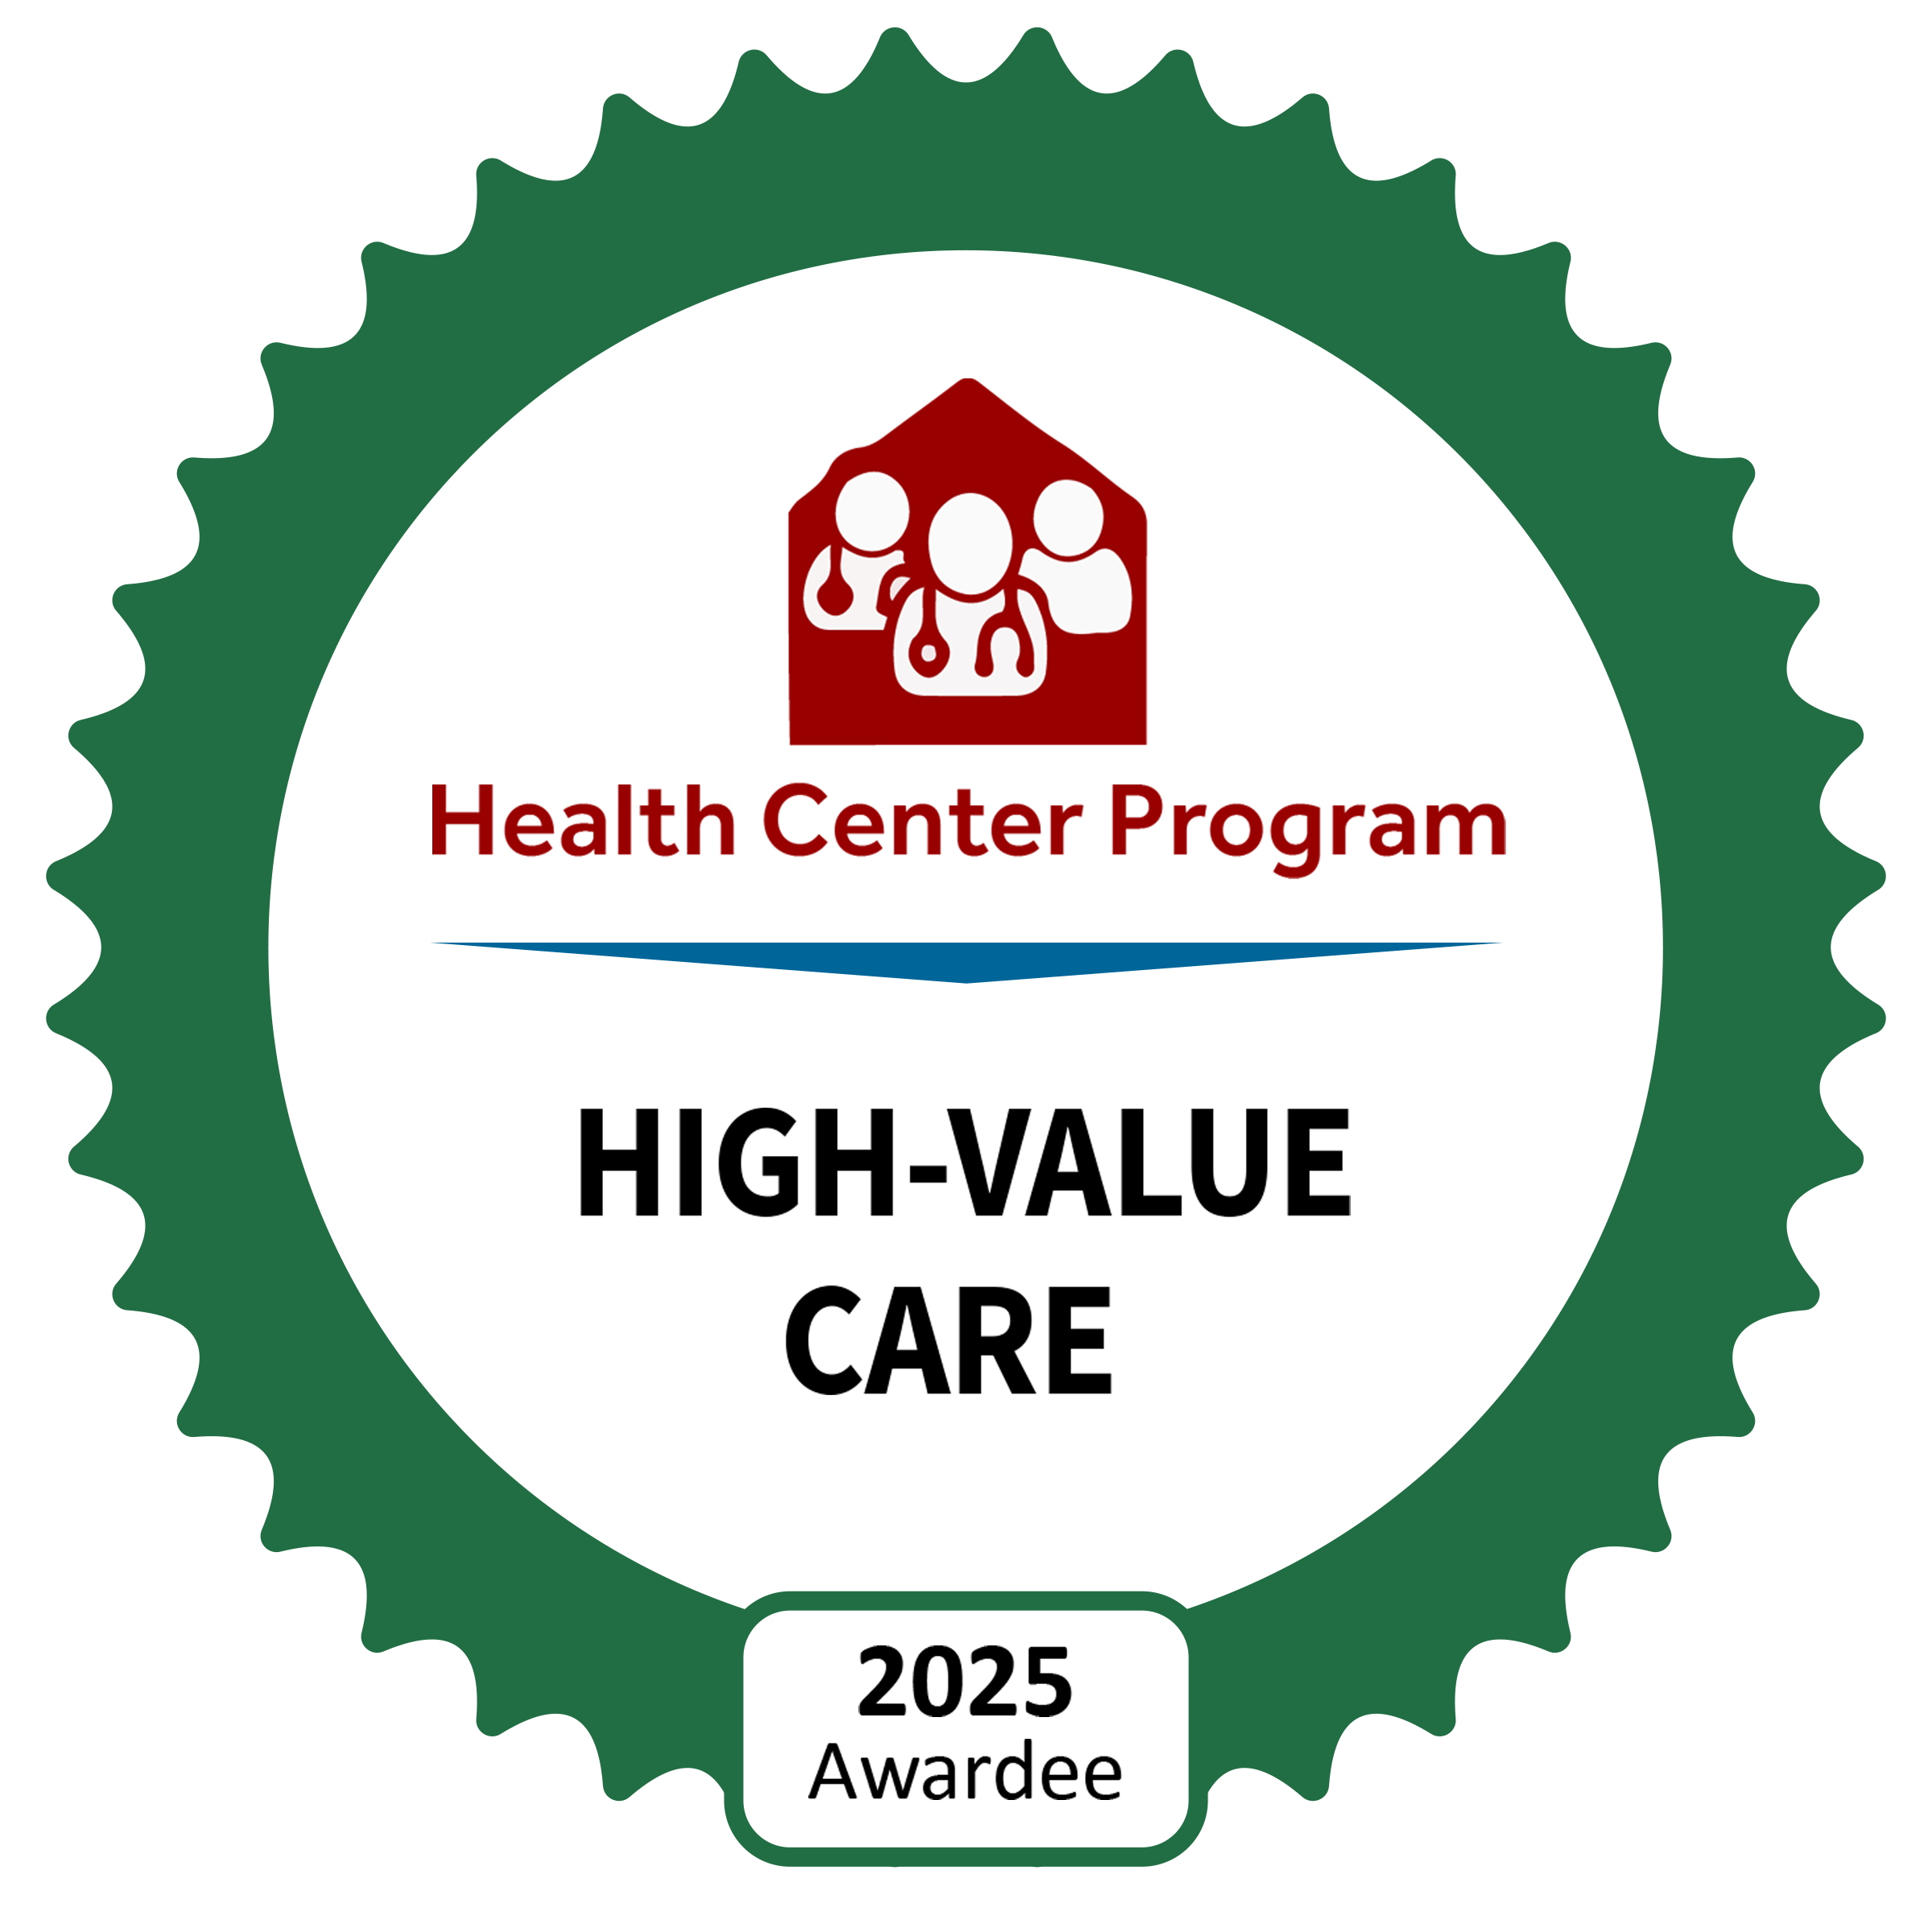
7.41%
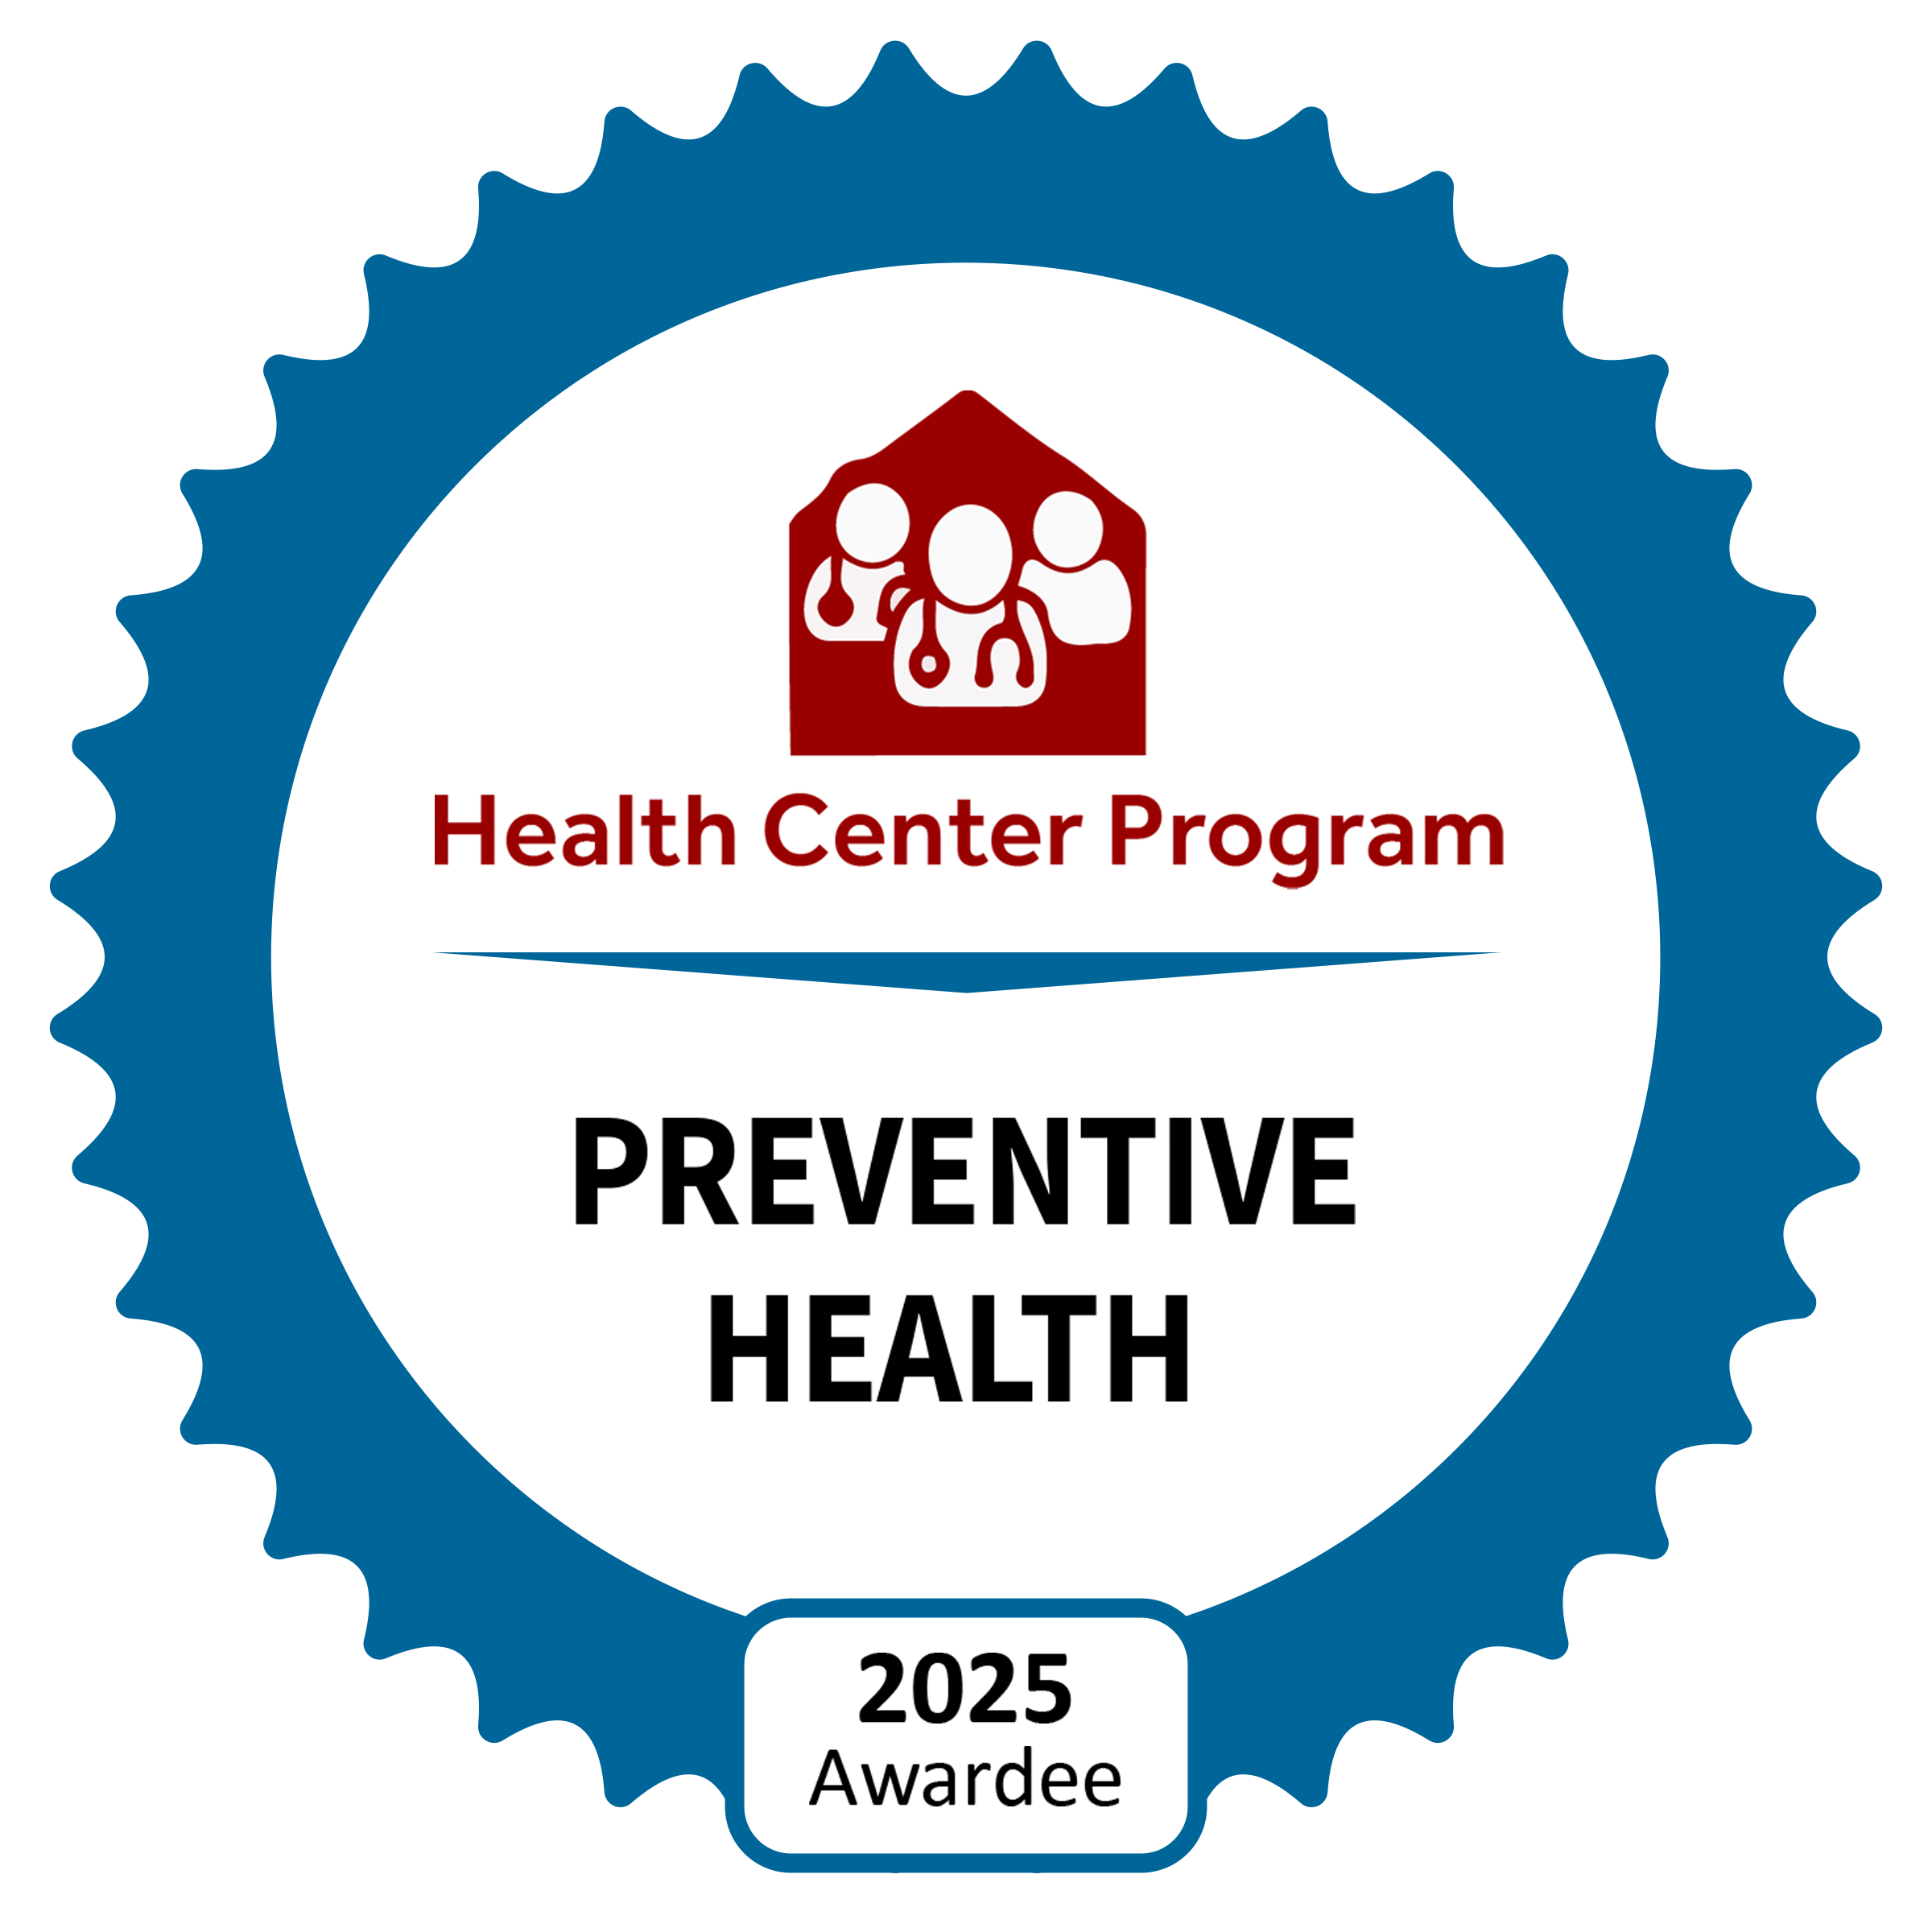
7.41%
100.00%
Note that percentages represent the number of health center awardees that met the criteria for each CHQR badge from a denominator of health centers that reported UDS data.
- View Full 2024 State Report
- Table 3A: Patients by Age and by Sex
- Table 3B: Demographic Characteristics
- Table 4: Selected Patient Characteristics
- Table 5: Staffing and Utilization
- Table 5: Selected Service Detail Addendum
- Table 6A: Selected Diagnoses and Services Rendered
- Table 6B: Quality of Care Measures
UDS Data Five-Year Summary
| Age and Race / Ethnicity | 2020 | 2021 | 2022 | 2023 | 2024 |
|---|---|---|---|---|---|
| Total Patients | 578,287 | 616,605 | 628,499 | 644,754 | 661,041 |
| Ages (% of total patients) | |||||
| % Children (< 18 years) | 33.73% | 35.21% | 34.83% | 33.93% | 34.03% |
| Children (< 18 years) | 195,035 | 217,113 | 218,881 | 218,747 | 224,984 |
| % Adults (18 – 64 years) | 57.29% | 55.52% | 55.49% | 55.96% | 55.99% |
| Adults (18 – 64 years) | 331,323 | 342,358 | 348,749 | 360,835 | 370,084 |
| % Older Adults (Ages 65 and over) | 8.98% | 9.27% | 9.68% | 10.11% | 9.98% |
| Older Adults (Ages 65 and over) | 51,929 | 57,134 | 60,869 | 65,172 | 65,973 |
| Patients By Race & Ethnicity (% known) | |||||
| % Racial and/or Ethnic Minority Patients | 35.80% | 36.21% | 36.15% | 36.67% | 36.16% |
| Number of Racial and/or Ethnic Minority Patients | 194,360 | 210,869 | 216,572 | 222,920 | 223,319 |
| % Hispanic, Latino/a, or Spanish Origin Patients | 9.24% | 9.57% | 9.87% | 10.33% | 10.86% |
| Number of Hispanic, Latino/a, or Spanish Origin Ethnicity Patients | 50,986 | 56,617 | 59,976 | 63,932 | 68,324 |
| % Non-Hispanic, Latino/a, or Spanish Origin White Patients | 66.21% | 65.87% | 65.47% | 65.59% | 66.07% |
| Number of Non-Hispanic, Latino/a, or Spanish Origin White Patients | 348,533 | 371,505 | 382,546 | 385,018 | 394,212 |
| % Total Asian Patients * | 1.36% | 1.35% | 1.43% | 1.35% | 1.61% |
| Number of Total Asian Patients * | 7,164 | 7,624 | 8,359 | 7,939 | 9,585 |
| % Native Hawaiian/Other Pacific Islander Patients * | 0.30% | 0.30% | 0.34% | 0.41% | 0.45% |
| Number of Native Hawaiian/Other Pacific Islander Patients * | 1,581 | 1,678 | 2,010 | 2,389 | 2,672 |
| % Black or African American Patients * | 23.86% | 23.60% | 22.80% | 22.97% | 21.91% |
| Number of Black or African American Patients * | 125,596 | 133,128 | 133,212 | 134,822 | 130,736 |
| % American Indian/Alaska Native Patients * | 0.47% | 0.51% | 0.59% | 0.64% | 0.93% |
| Number of American Indian/Alaska Native Patients * | 2,467 | 2,879 | 3,451 | 3,748 | 5,569 |
| % More than one race Patients * | 2.33% | 2.89% | 3.23% | 3.13% | 2.50% |
| Number of Patients with More than one race * | 12,283 | 16,317 | 18,853 | 18,361 | 14,920 |
| Total Patients with Known Race Ethnicity (Denominator) | 526,390 | 564,003 | 584,275 | 586,985 | 596,632 |
| Total Racial and/or Ethnic Minority Patients (Denominator) | 542,893 | 582,374 | 599,118 | 607,938 | 617,531 |
| Total Hispanic, Latino/a, or Spanish Origin & Non-Hispanic, Latino/a, or Spanish Origin Patients (Denominator for Hispanic, Latino/a, or Spanish Origin Ethnicity) | 552,051 | 591,633 | 607,947 | 618,764 | 629,188 |
| Language (% known) | |||||
| % Best Served in a Language other than English | 6.95% | 6.80% | 7.52% | 8.02% | 8.76% |
| Number of Patients Best Served in a Language Other than English | 40,191 | 41,938 | 47,250 | 51,734 | 57,932 |
| Patient Characteristics | 2020 | 2021 | 2022 | 2023 | 2024 |
|---|---|---|---|---|---|
| Income Status (% of patients with known income) | |||||
| Total Patients with Known Income (Denominator) | 383,286 | 414,719 | 427,888 | 435,430 | 441,512 |
| % Patients at or Below 200% of Federal Poverty Guideline | 93.55% | 93.74% | 92.75% | 91.56% | 91.76% |
| Patients at or Below 200% of Federal Poverty Guideline | 358,559 | 388,774 | 396,860 | 398,686 | 405,138 |
| % Patients at or Below 100% of Federal Poverty Guideline (included in above) | 67.66% | 67.56% | 68.08% | 66.60% | 68.22% |
| Patients at or Below 100% of Federal Poverty Guideline (included in above) | 259,316 | 280,164 | 291,289 | 290,008 | 301,199 |
| Insurance Status (% of total patients) | |||||
| % None/Uninsured Patients | 25.81% | 22.53% | 17.03% | 15.77% | 17.36% |
| None/Uninsured Patients | 149,257 | 138,913 | 107,015 | 101,665 | 114,734 |
| % None/Uninsured Children (<18 years) | 9.45% | 8.99% | 8.11% | 8.86% | 12.12% |
| None/Uninsured Children (<18 years) | 18,424 | 19,529 | 17,751 | 19,390 | 27,265 |
| % Medicaid/CHIP Patients * | 41.31% | 45.14% | 51.71% | 53.37% | 51.24% |
| Medicaid/CHIP Patients * | 238,895 | 278,317 | 324,970 | 344,114 | 338,700 |
| % Medicare Patients | 9.05% | 9.37% | 9.34% | 9.65% | 9.04% |
| Medicare Patients | 52,341 | 57,785 | 58,672 | 62,207 | 59,752 |
| % Dually Eligible (Medicare and Medicaid) | 3.70% | 3.60% | 3.46% | 4.02% | 3.55% |
| Dually Eligible (Medicare and Medicaid) | 21,413 | 22,211 | 21,772 | 25,913 | 23,461 |
| % Other Third-Party Patients | 23.83% | 22.96% | 21.93% | 21.21% | 22.37% |
| Other Third-Party Patients | 137,794 | 141,590 | 137,842 | 136,768 | 147,855 |
| Total Patients | 578,287 | 616,605 | 628,499 | 644,754 | 661,041 |
| Children (< 18 years) | 195,035 | 217,113 | 218,881 | 218,747 | 224,984 |
| Special Populations | |||||
| % Homeless Patients | 2.93% | 3.40% | 3.55% | 3.61% | 3.76% |
| Total Homeless Patients | 16,934 | 20,976 | 22,295 | 23,292 | 24,825 |
| % Total Migratory and Seasonal Agricultural Workers or Their Family Members | 0.22% | 0.22% | 0.28% | 0.36% | 0.91% |
| Total Migratory and Seasonal Agricultural Workers or Their Family Members (All health centers report this line) | 1,248 | 1,361 | 1,758 | 2,323 | 5,987 |
| % Public Housing Patients | 21.59% | 23.49% | 24.03% | 24.90% | 27.40% |
| Total Patients Served at a Health Center Located In or Immediately Accessible to a Public Housing Site | 124,844 | 144,823 | 151,044 | 160,542 | 181,119 |
| % School-Based Service Site Patients | 1.58% | 1.59% | 1.60% | 3.52% | 3.54% |
| School-Based Service Site Patients | 9,112 | 9,774 | 10,032 | 22,692 | 23,419 |
| % Veterans Patients | 1.87% | 2.04% | 1.92% | 2.01% | 2.06% |
| Veterans Patients | 10,832 | 12,583 | 12,037 | 12,954 | 13,587 |
| Number of Female Patients (ages 15-44) | 147,235 | 155,771 | 160,413 | 165,542 | 170,317 |
| % Patients Under 15 Who are Female | 23.98% | 24.93% | 24.41% | 23.66% | 23.74% |
| Number of Patients Under 15 Who are Female | 79,555 | 88,170 | 87,856 | 87,506 | 89,412 |
| Patients 15-64 Who are Female | 66.92% | 65.62% | 65.78% | 66.09% | 66.14% |
| Number of Patients 15-64 Who are Female | 222,065 | 232,122 | 236,757 | 244,463 | 249,081 |
| Patients 65 and Over Who are Female | 9.10% | 9.45% | 9.81% | 10.26% | 10.12% |
| Number of Patients 65 and Over Who are Female | 30,196 | 33,442 | 35,318 | 37,937 | 38,123 |
| Total Female Patients (Denominator) | 331,816 | 353,734 | 359,931 | 369,906 | 376,616 |
| Services (% of patients) | 2020 | 2021 | 2022 | 2023 | 2024 |
|---|---|---|---|---|---|
| % Medical Patients | 63.76% | 62.17% | 63.38% | 63.51% | 64.39% |
| Medical Patients | 368,691 | 383,366 | 398,361 | 409,454 | 425,672 |
| % Dental Patients | 36.20% | 38.61% | 39.91% | 40.54% | 41.53% |
| Dental Patients | 209,342 | 238,062 | 250,819 | 261,370 | 274,557 |
| % Mental Health Patients | 12.81% | 13.14% | 14.14% | 14.63% | 14.67% |
| Mental Health Patients | 74,086 | 80,996 | 88,856 | 94,346 | 96,956 |
| % Substance Use Disorder Patients | 0.85% | 1.29% | 1.56% | 2.07% | 2.45% |
| Substance Use Disorder Patients | 4,895 | 7,964 | 9,780 | 13,345 | 16,184 |
| % Vision Patients | 1.85% | 1.85% | 1.98% | 2.60% | 2.91% |
| Vision Patients | 10,674 | 11,423 | 12,425 | 16,748 | 19,232 |
| % Enabling Services Patients | 5.46% | 7.31% | 7.29% | 8.45% | 7.47% |
| Enabling Services Patients | 31,557 | 45,099 | 45,827 | 54,492 | 49,381 |
| Total Patients | 578,287 | 616,605 | 628,499 | 644,754 | 661,041 |
| Clinical Data | 2020 | 2021 | 2022 | 2023 | 2024 |
|---|---|---|---|---|---|
| Patients | |||||
| Medical Conditions (% of Patients with Medical Conditions) | |||||
| % Hypertension Patients * | 36.07% | 38.26% | 33.40% | 32.48% | 32.68% |
| Number of Hypertension Patients * | 87,244 | 94,029 | 85,771 | 86,917 | 90,835 |
| % Diabetes Patients * | 16.33% | 16.85% | 16.91% | 16.64% | 16.96% |
| Number of Diabetes Patients * | 38,157 | 39,943 | 41,798 | 42,787 | 45,303 |
| % Asthma | 4.59% | 4.53% | 4.58% | 5.07% | 5.00% |
| Number of Asthma Patients | 16,932 | 17,362 | 18,250 | 20,762 | 21,273 |
| % Symptomatic/Asymptomatic human immunodeficiency virus (HIV) | 0.40% | 0.41% | 0.43% | 0.45% | 0.45% |
| Number of Symptomatic/Asymptomatic human immunodeficiency virus (HIV) | 1,471 | 1,563 | 1,717 | 1,824 | 1,906 |
| Prenatal | |||||
| Number of Prenatal Care Patients | 10,625 | 9,616 | 10,006 | 9,290 | 9,470 |
| Number of Prenatal Care Patients who Delivered | 5,633 | 5,009 | 5,554 | 5,035 | 5,164 |
| Quality of Care Measures | |||||
| Perinatal Health | |||||
| Early Entry into Prenatal Care (first visit in first trimester) | 70.24% | 71.82% | 70.12% | 71.19% | 67.21% |
| Number of Access to Prenatal Care (First Prenatal Visit in 1st Trimester) | 7,463 | 6,906 | 7,016 | 6,614 | 6,365 |
| % Low and Very Low Birth Weight | 10.63% | 10.25% | 10.58% | 9.31% | 9.77% |
| Number of Newborns with Low Birth Weight | 601 | 517 | 588 | 465 | 498 |
| Preventive Health Screening & Services | |||||
| Cervical Cancer Screening * | 49.59% | 47.32% | 45.99% | 44.41% | 47.87% |
| Number of Patients Screened for Cervical Cancer * | 53,078 | 53,252 | 53,180 | 56,143 | 58,955 |
| Breast Cancer Screening | 39.85% | 35.88% | 39.73% | 39.02% | 42.54% |
| Number of Patients Screened for Breast Cancer | 18,513 | 18,735 | 21,100 | 22,543 | 24,210 |
| Weight Assessment and Counseling for Nutrition and Physical Activity for Children and Adolescents * | 63.11% | 60.76% | 64.79% | 65.66% | 70.46% |
| Number of Children Age 3-17 with Weight Assessment and Counseling for Nutrition and Physical Activity * | 41,495 | 45,260 | 50,143 | 58,483 | 65,307 |
| Body Mass Index (BMI) Screening and Follow-Up Plan * | 78.03% | 73.87% | 74.03% | 75.67% | 74.85% |
| Number of Adult Medical Patients Age 18 and Older with Body Mass Index (BMI) Screening and Follow-Up * | 183,770 | 184,761 | 191,853 | 231,859 | 236,792 |
| Percent Adults Screened for Tobacco Use and Receiving Cessation Intervention * | 84.02% | 86.77% | 87.23% | 87.21% | 83.97% |
| Number of Adult Medical Patients Age 12 and Older Screened for Tobacco Use and Received Cessation Counseling * | 146,113 | 151,442 | 159,574 | 197,134 | 219,167 |
| Colorectal Cancer Screening * | 36.54% | 35.15% | 33.95% | 32.11% | 33.06% |
| Number of Patients Screened for Colorectal Cancer * | 34,781 | 34,574 | 34,391 | 41,900 | 43,980 |
| Childhood Immunization Status * | 26.24% | 25.42% | 20.53% | 18.70% | 17.58% |
| Number of Children Under Age 3 Who Received Appropriate Childhood Immunizations * | 1,434 | 1,417 | 1,188 | 1,133 | 1,208 |
| Screening for Depression and Follow-Up Plan * | 75.09% | 74.36% | 76.95% | 74.98% | 79.70% |
| Number of Patients Screened for Clinical Depression and if Positive had a Follow-Up Plan Documented * | 183,091 | 175,828 | 185,006 | 184,228 | 265,780 |
| Depression Remission at Twelve Months * | - | - | - | - | - |
| Number of Patients 12 years of age and older with major depression or dysthymia who reached remission 12 months (+/- 60 days) after an index event | 449 | 697 | 919 | 1,779 | 1,739 |
| Dental Sealants for Children between 6-9 Years * | - | - | - | - | - |
| Number of Children Age 6-9 Who Received Dental Sealants | 5,086 | 6,702 | 8,174 | 9,495 | 9,376 |
| HIV Screening * | - | - | - | - | - |
| Number of Patients 15 through 65 years of age who were tested for HIV when within age range | 56,756 | 71,578 | 85,843 | 102,741 | 116,371 |
| Chronic Disease Management | |||||
| Statin Therapy for the Prevention and Treatment of Cardiovascular Disease * | 77.71% | 77.45% | 77.52% | 77.13% | 77.71% |
| Number of Patients at High Risk of Cardiovascular Events who were Prescribed or were on Statin Therapy * | 31,779 | 34,738 | 39,920 | 41,353 | 47,518 |
| Ischemic Vascular Disease (IVD): Use of Aspirin or Another Antiplatelet * | 76.71% | 78.91% | 76.96% | 77.43% | 75.20% |
| Number of Patients Age 18 and Older Diagnosed with Ischemic Vascular Disease (IVD): Use of Aspirin or Another Antithrombotic * | 6,492 | 6,345 | 6,825 | 7,093 | 7,619 |
| Controlling High Blood Pressure * | 58.30% | 60.84% | 63.54% | 65.64% | 66.87% |
| Number of Patients with Hypertension (HTN) Whose Blood Pressure (BP) was Controlled (< 140/90 mmHg) * | 50,860 | 57,206 | 54,499 | 57,051 | 60,741 |
| Diabetes: Hemoglobin A1c Poor Control * | 35.01% | 30.64% | 29.59% | 27.76% | 28.52% |
| Number of Diabetic Patients with Poorly Controlled Hemoglobin A1c (HbA1c > 9%) or No Test During Year * | 13,358 | 12,238 | 12,370 | 11,877 | 12,918 |
| % of Patients seen for follow-up within 30 days of first ever HIV diagnosis | 83.67% | 74.14% | 70.59% | 84.50% | 81.12% |
| Number of HIV Patients Who were Newly Diagnosed HIV and Received Follow-up Treatment | 41 | 43 | 48 | 169 | 202 |
| Cost Data | 2020 | 2021 | 2022 | 2023 | 2024 |
|---|---|---|---|---|---|
| Total Health Center Cluster | $101,516,795 | $123,291,369 | $114,949,379 | $114,735,505 | $119,513,627 |
| Total Cost | $625,852,189 | $686,495,277 | $779,042,972 | $879,764,335 | $989,740,238 |
| Total Accrued Cost per Patient | $1,082.25 | $1,113.35 | $1,239.53 | $1,364.50 | $1,497.24 |
Footnotes
'-' Data cannot be calculated or has been suppressed for confidentiality purposes.
Cells that are shaded blue represent data that was not reported or null values.
View Detailed UDS Footnotes
Accessibility Statement:
Persons using assistive technology may not be able to fully access information in these files. For assistance, contact the Health Center Program Support at: 877-464-4772.


